Financial
Transaction Insights
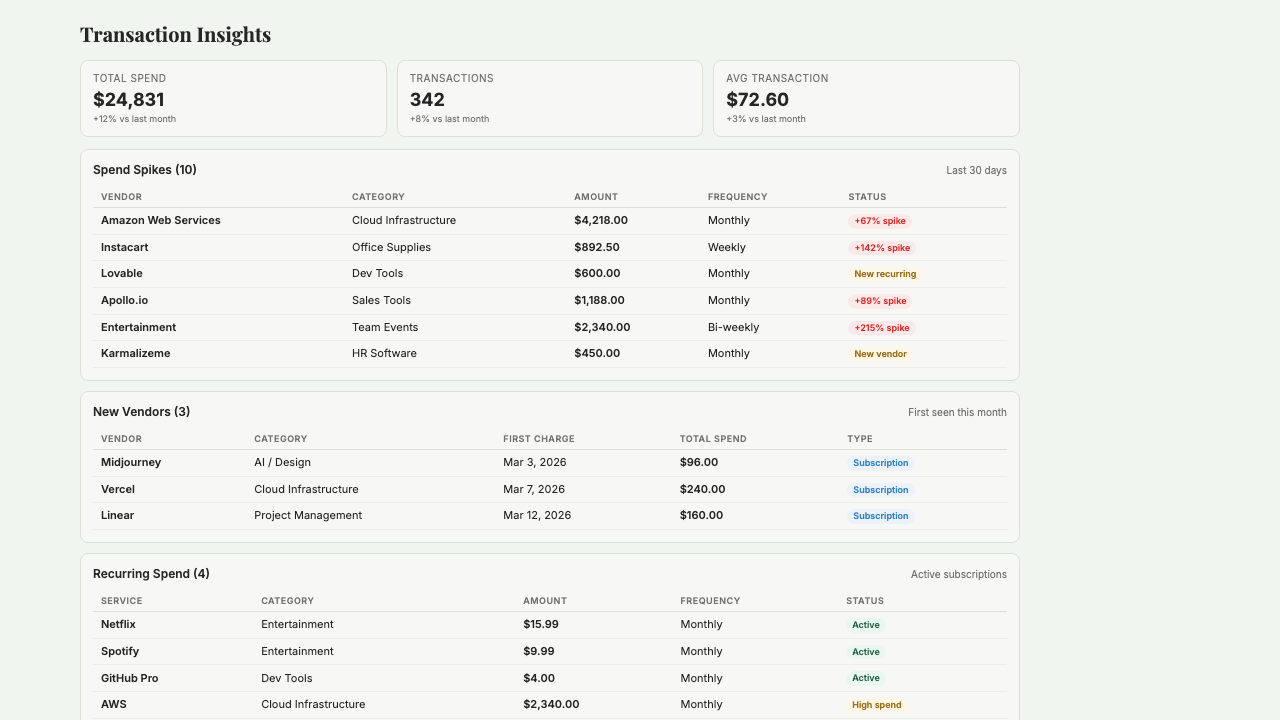
Analyze bank transactions with category breakdowns, spending trends, and anomaly detection from your connected Plaid accounts.
What is Transaction Insights?
Transaction Insights is a live spending dashboard that pulls every transaction from your connected Plaid bank accounts and tells you where your money is actually going — in plain English, not buried in accounting software. It shows month-over-month trends by category and vendor, flags anomalies automatically (a $2,000 charge that's normally $200), tracks recurring subscriptions so you know exactly what's on autopay, and alerts you to any new vendor that's charged your account in the last 60 days. Built for operator founders and small teams who want to catch surprises before they become a pattern and know at a glance whether this month's spending looks like last month's.
Key Features
Who it's for
- Operator founders who don't look at QuickBooks often enough to catch weird charges
- Small teams trying to get a grip on subscription sprawl
- Founders with inventory-heavy cash flows who need to track spikes in real time
- Anyone running multiple business bank accounts who wants consolidated spending visibility
Example workflows
Weekly spending review in 5 minutes
- 1Open Transaction Insights on Monday morning.
- 2Review flagged anomalies from the past 7 days and confirm each is legitimate.
- 3Scan new vendor alerts — anyone charging your account for the first time in 60 days.
- 4Compare this week's category spend to the same week last month and flag any category drifting up.
Audit your recurring subscriptions
- 1Ask Transaction Insights to list all recurring charges sorted by annual cost.
- 2Review the list for subscriptions you don't recognize or no longer use.
- 3Cross-check against your actual tool usage — anything you haven't opened in 60+ days is a candidate to cancel.
- 4Cancel the dead weight (directly with the vendor) or mark them for a decision this week.
What you can ask
"What are my biggest spending categories this month?"
"Which merchants do I spend the most with?"
"How does this month compare to last month?"
"Show me any unusually large transactions"
"What is my average daily spending?"
Frequently asked questions
Does this replace QuickBooks?
No. QuickBooks is for tax-ready reconciled books. Transaction Insights is for the daily 'what am I spending on?' question using live bank data. Most founders run both: QuickBooks for compliance, Transaction Insights for day-to-day awareness of where cash is going.
How does anomaly detection work?
Starch compares each transaction to your historical pattern for that vendor or category. A charge that's several times larger than the typical pattern gets flagged. You can tune the sensitivity so you're not getting pinged by minor variance but still catch the ones that matter.
Can it detect fraud?
Indirectly. Fraudulent charges usually show up as new vendors or unusually large transactions, both of which are flagged. It's not a replacement for your bank's fraud detection, but it's a useful second pair of eyes — especially for smaller unauthorized charges that bank alerts might miss.
What if Plaid miscategorizes transactions?
You can recategorize any transaction manually, and Starch learns from your corrections. After the first few weeks of use, accuracy is usually 95%+ for your specific spending patterns.
Does it work with multiple accounts?
Yes. Connect as many bank accounts as Plaid supports (most major US banks). Transactions are aggregated across accounts into a single spending view, and you can drill into any individual account when you need to.
Can I see spending by project or department?
Basic tagging is supported — you can tag transactions with project or department labels for a rough breakdown. For deep cost-center accounting or P&L by department, you still want QuickBooks or a dedicated tool.
Get started with Transaction Insights
Join founders already using Starch to run their business smarter.
You're on the list! We'll be in touch soon.