Financial
Runway Analysis
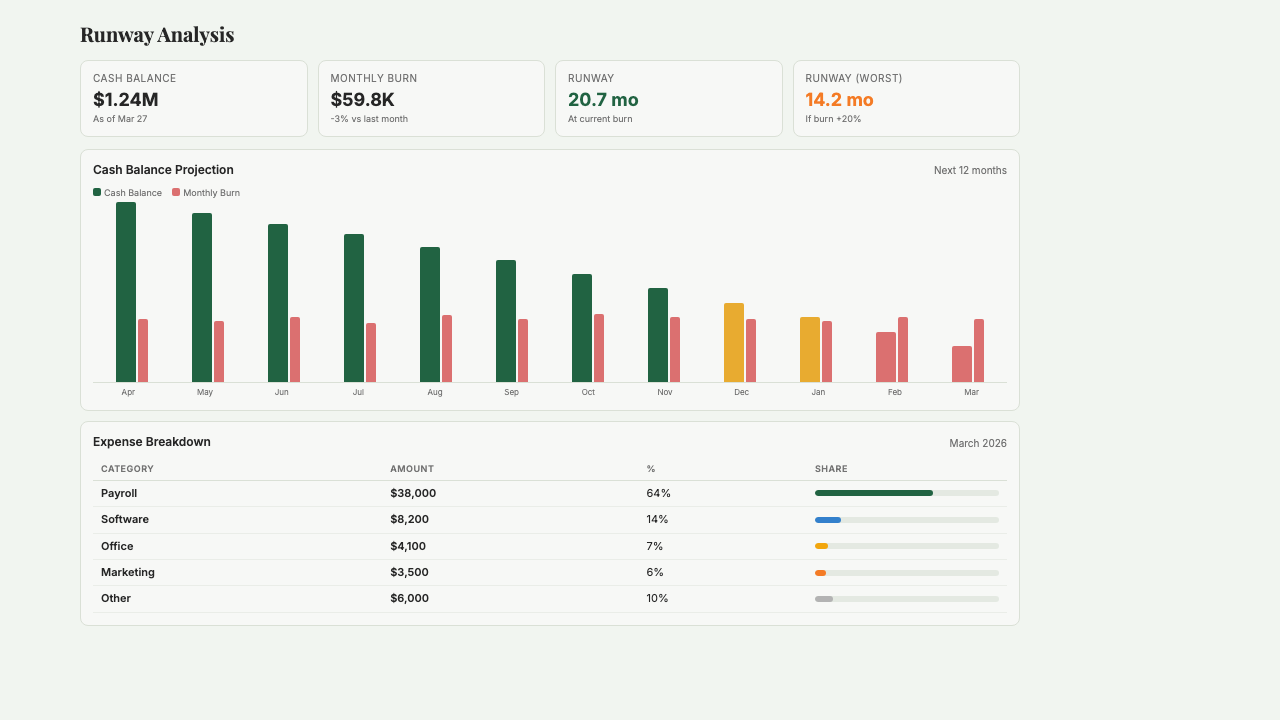
Track burn rate and financial runway by combining Stripe revenue with bank account expenses from Plaid.
What is Runway Analysis?
Runway Analysis is a live burn rate and cash projection dashboard that combines revenue from Stripe with expense data from Plaid bank feeds to show you exactly how many months of cash you have left at your current pace. It calculates real net burn — not the wrong number you'd get from averaging a single month — with 6-month historical trends, 24-month forward projections, and expense breakdowns by category. No spreadsheets, no manual uploads, and no waiting for your bookkeeper to close the books. Built for operator founders and small teams who need to know 'when do I need to raise?' at a glance and want the answer updated daily instead of monthly.
Key Features
Who it's for
- Seed and Series A founders who need to know their runway at a glance, not after a month-end close
- Operator founders running CPG brands with inventory-heavy burn who can't eyeball cash flow
- Small teams preparing to raise who need board-ready runway numbers on short notice
- Founders running multiple entities or subsidiaries who want consolidated cash visibility
Example workflows
Set up Runway Analysis for the first time
- 1Connect Stripe (for revenue) and Plaid (for bank transactions) via their standard OAuth flows.
- 2Wait a few minutes for Starch to pull the last 6 months of transaction history.
- 3Review the expense categorization — adjust any transactions Plaid mislabeled (usually 5–10% of the ledger).
- 4Set your preferred burn window (30 days is the default) and the projection horizon (24 months is standard).
- 5Bookmark the dashboard or ask Starch to include runway metrics in your weekly digest.
Get a board-ready runway number on short notice
- 1Open Runway Analysis and screenshot the current state: months of runway, net burn, cash position.
- 2Ask Starch to export a PDF with the 6-month trend chart and 24-month projection.
- 3Add a short narrative: what changed this month and what's driving the direction.
- 4Drop the chart into your board deck — or let Investor Reporting pull it in automatically if you're already using that app.
What you can ask
"What is my current monthly burn rate?"
"How has revenue trended over the last 6 months?"
"What are my biggest expense categories?"
"When will I run out of cash at the current burn rate?"
"How much runway do I have left?"
Frequently asked questions
Where does the revenue and expense data come from?
Revenue comes from Stripe (and optionally other payment processors you connect). Expenses come from Plaid bank feeds, which pull transaction-level data from your operating accounts. This matches what's actually leaving your bank, not what's in your accounting system — which is why the runway number is accurate even before your bookkeeper closes the month.
How is this different from what QuickBooks or Xero shows?
Accounting systems show you historical, reconciled numbers — usually one month behind. Runway Analysis uses live bank data, so today's burn reflects today's spending. The tradeoff is that it's a real-time estimate, not a tax-ready set of books. Most founders run both: QuickBooks for compliance, Runway Analysis for the daily 'how much cash do I have?' question.
What counts as net burn in your calculation?
Net burn is total expenses minus total revenue for the period. Starch uses a trailing 30-day window by default, because single-month snapshots can be skewed by the timing of large bills. You can change the window (14 days, 60 days, 90 days) depending on how much smoothing you want.
Can I exclude certain transactions from the burn calculation?
Yes. You can exclude one-off expenses (like legal fees for a financing or a refund) and recategorize transactions Plaid mislabeled. Starch learns from your corrections, so future categorization gets more accurate over time.
Does the projection factor in growth, or assume constant burn?
By default, the 24-month projection uses trailing 30-day burn — a steady-state view. For scenario planning (growing revenue, planned hires), use the Scenario Analysis app instead, which models multiple futures side-by-side. Runway Analysis is for the 'where am I right now' question, not 'where could I be.'
What if I have multiple bank accounts?
Connect them all. Starch aggregates across accounts and entities — operating accounts, savings, payroll, FBO accounts — into a single cash position and a single burn number. You can see the breakdown by account if you want, or just the consolidated total.
Get started with Runway Analysis
Join founders already using Starch to run their business smarter.
You're on the list! We'll be in touch soon.