Financial
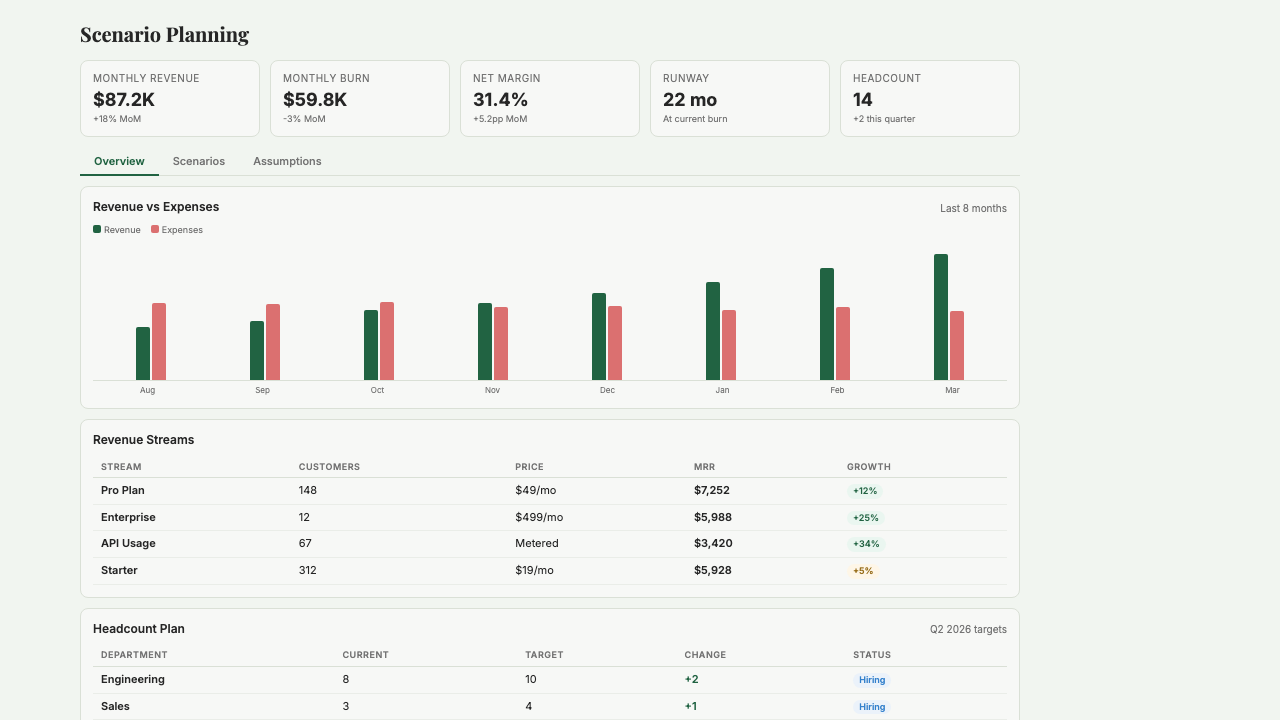
Scenario Analysis
Model financial futures using live Stripe revenue and Plaid expenses — compare growth, headcount, and burn scenarios side by side.
What is Scenario Analysis?
Scenario Analysis is a financial modeling tool that lets you compare multiple futures side-by-side — what happens if you double hiring, raise prices, delay a raise, or grow revenue 20% slower than plan. Instead of building scenarios from scratch in a spreadsheet, you connect Stripe and Plaid so the baseline reflects your actual revenue and burn, then adjust only the assumptions you want to test. Each scenario shows runway, burn rate, and break-even under its specific conditions. Built for operator founders making real decisions — hiring, pricing, fundraising timing — who need to see the financial consequences before committing, but don't have a finance hire to model them out in Excel every time something changes.
Key Features
Who it's for
- Founders weighing hiring decisions against remaining runway
- Operator founders preparing for a raise who need multiple burn scenarios ready for investors
- Small teams modeling the impact of a pricing change before shipping it
- Founders running multiple product lines who need to see scenarios play out per line
Example workflows
Model the runway impact of a new hiring round
- 1Open a new scenario and duplicate your base case.
- 2Add the new hires with salary, start date, and benefits/taxes.
- 3Set a revenue assumption (optimistic, base, conservative) for how fast you expect to grow.
- 4Compare the scenarios side-by-side: runway, burn, break-even under each.
- 5Pick the scenario you're comfortable presenting to the team or investors.
Test a pricing change before committing
- 1Duplicate your base case as 'Pricing +20%'.
- 2Adjust the pricing assumption: higher ARPU and a realistic churn impact.
- 3Compare net revenue impact over 12 months against the base case.
- 4Decide based on the trade-off (higher ARPU vs. churn risk), not a gut feel.
What you can ask
"What is my current burn rate and runway?"
"What if we raise subscription price to $149?"
"What if we double engineering hiring next quarter?"
"Compare base case vs growth scenario"
"How many customers do we need to break even?"
Frequently asked questions
How is this different from a spreadsheet model?
Speed and live data. A spreadsheet model takes hours to build, starts going stale the day you finish it, and depends on you remembering to update the actuals. Scenario Analysis uses live Stripe and Plaid feeds as the baseline, so the starting point is always current. You only edit the assumptions you want to test, not the entire model.
How is this different from Runway Analysis?
Runway Analysis tells you where you are right now — current burn, current runway, current cash. Scenario Analysis tells you where you could be — what happens if you change something. Most founders use them together: Runway for the daily 'how much cash do I have' question, Scenario for the 'what if' questions around hiring, pricing, and fundraising.
Can I compare more than two scenarios at once?
Yes, typically up to 5 side-by-side. That's usually enough to compare base case, upside, downside, and a couple of specific decisions (new hire, pricing change). Beyond 5, the comparison view gets too dense to be useful.
Does it factor in revenue growth, or just expense changes?
Both. You can model revenue curves (growth rate, churn, ARPU), expense changes (new hires, ad spend shifts, one-time costs), or any combination in each scenario. The base case inherits your actual Stripe revenue trajectory; scenarios adjust from there.
How accurate are the projections?
Only as accurate as your assumptions. The live actuals are exact; the forward-looking numbers depend on the inputs you set. Scenario Analysis shows the math behind each scenario clearly — it's a calculator for your assumptions, not a predictor. Garbage in, garbage out applies.
Can I export scenarios to share with investors or a board?
Yes. You can export any scenario as a PDF with charts and assumptions, or pull it directly into Investor Reporting if you're already using that app. The exported version includes the assumption summary so your investors can see exactly what you modeled.
Get started with Scenario Analysis
Join founders already using Starch to run their business smarter.
You're on the list! We'll be in touch soon.